Infographics
Industry: Miscellaneous
Design area: Data visualisation, Illustration
Data visualisation is one of the design areas I enjoy the most, as it combines analytical thinking, artistic expression, and the ability to make information accessible and captivating. Through infographics, I can bridge the gap between raw content and audience understanding, enabling them to grasp insights and make informed decisions. I find immense satisfaction in the process of distilling complex content into visually appealing and impactful designs that empower others with knowledge and promote informed decision-making.
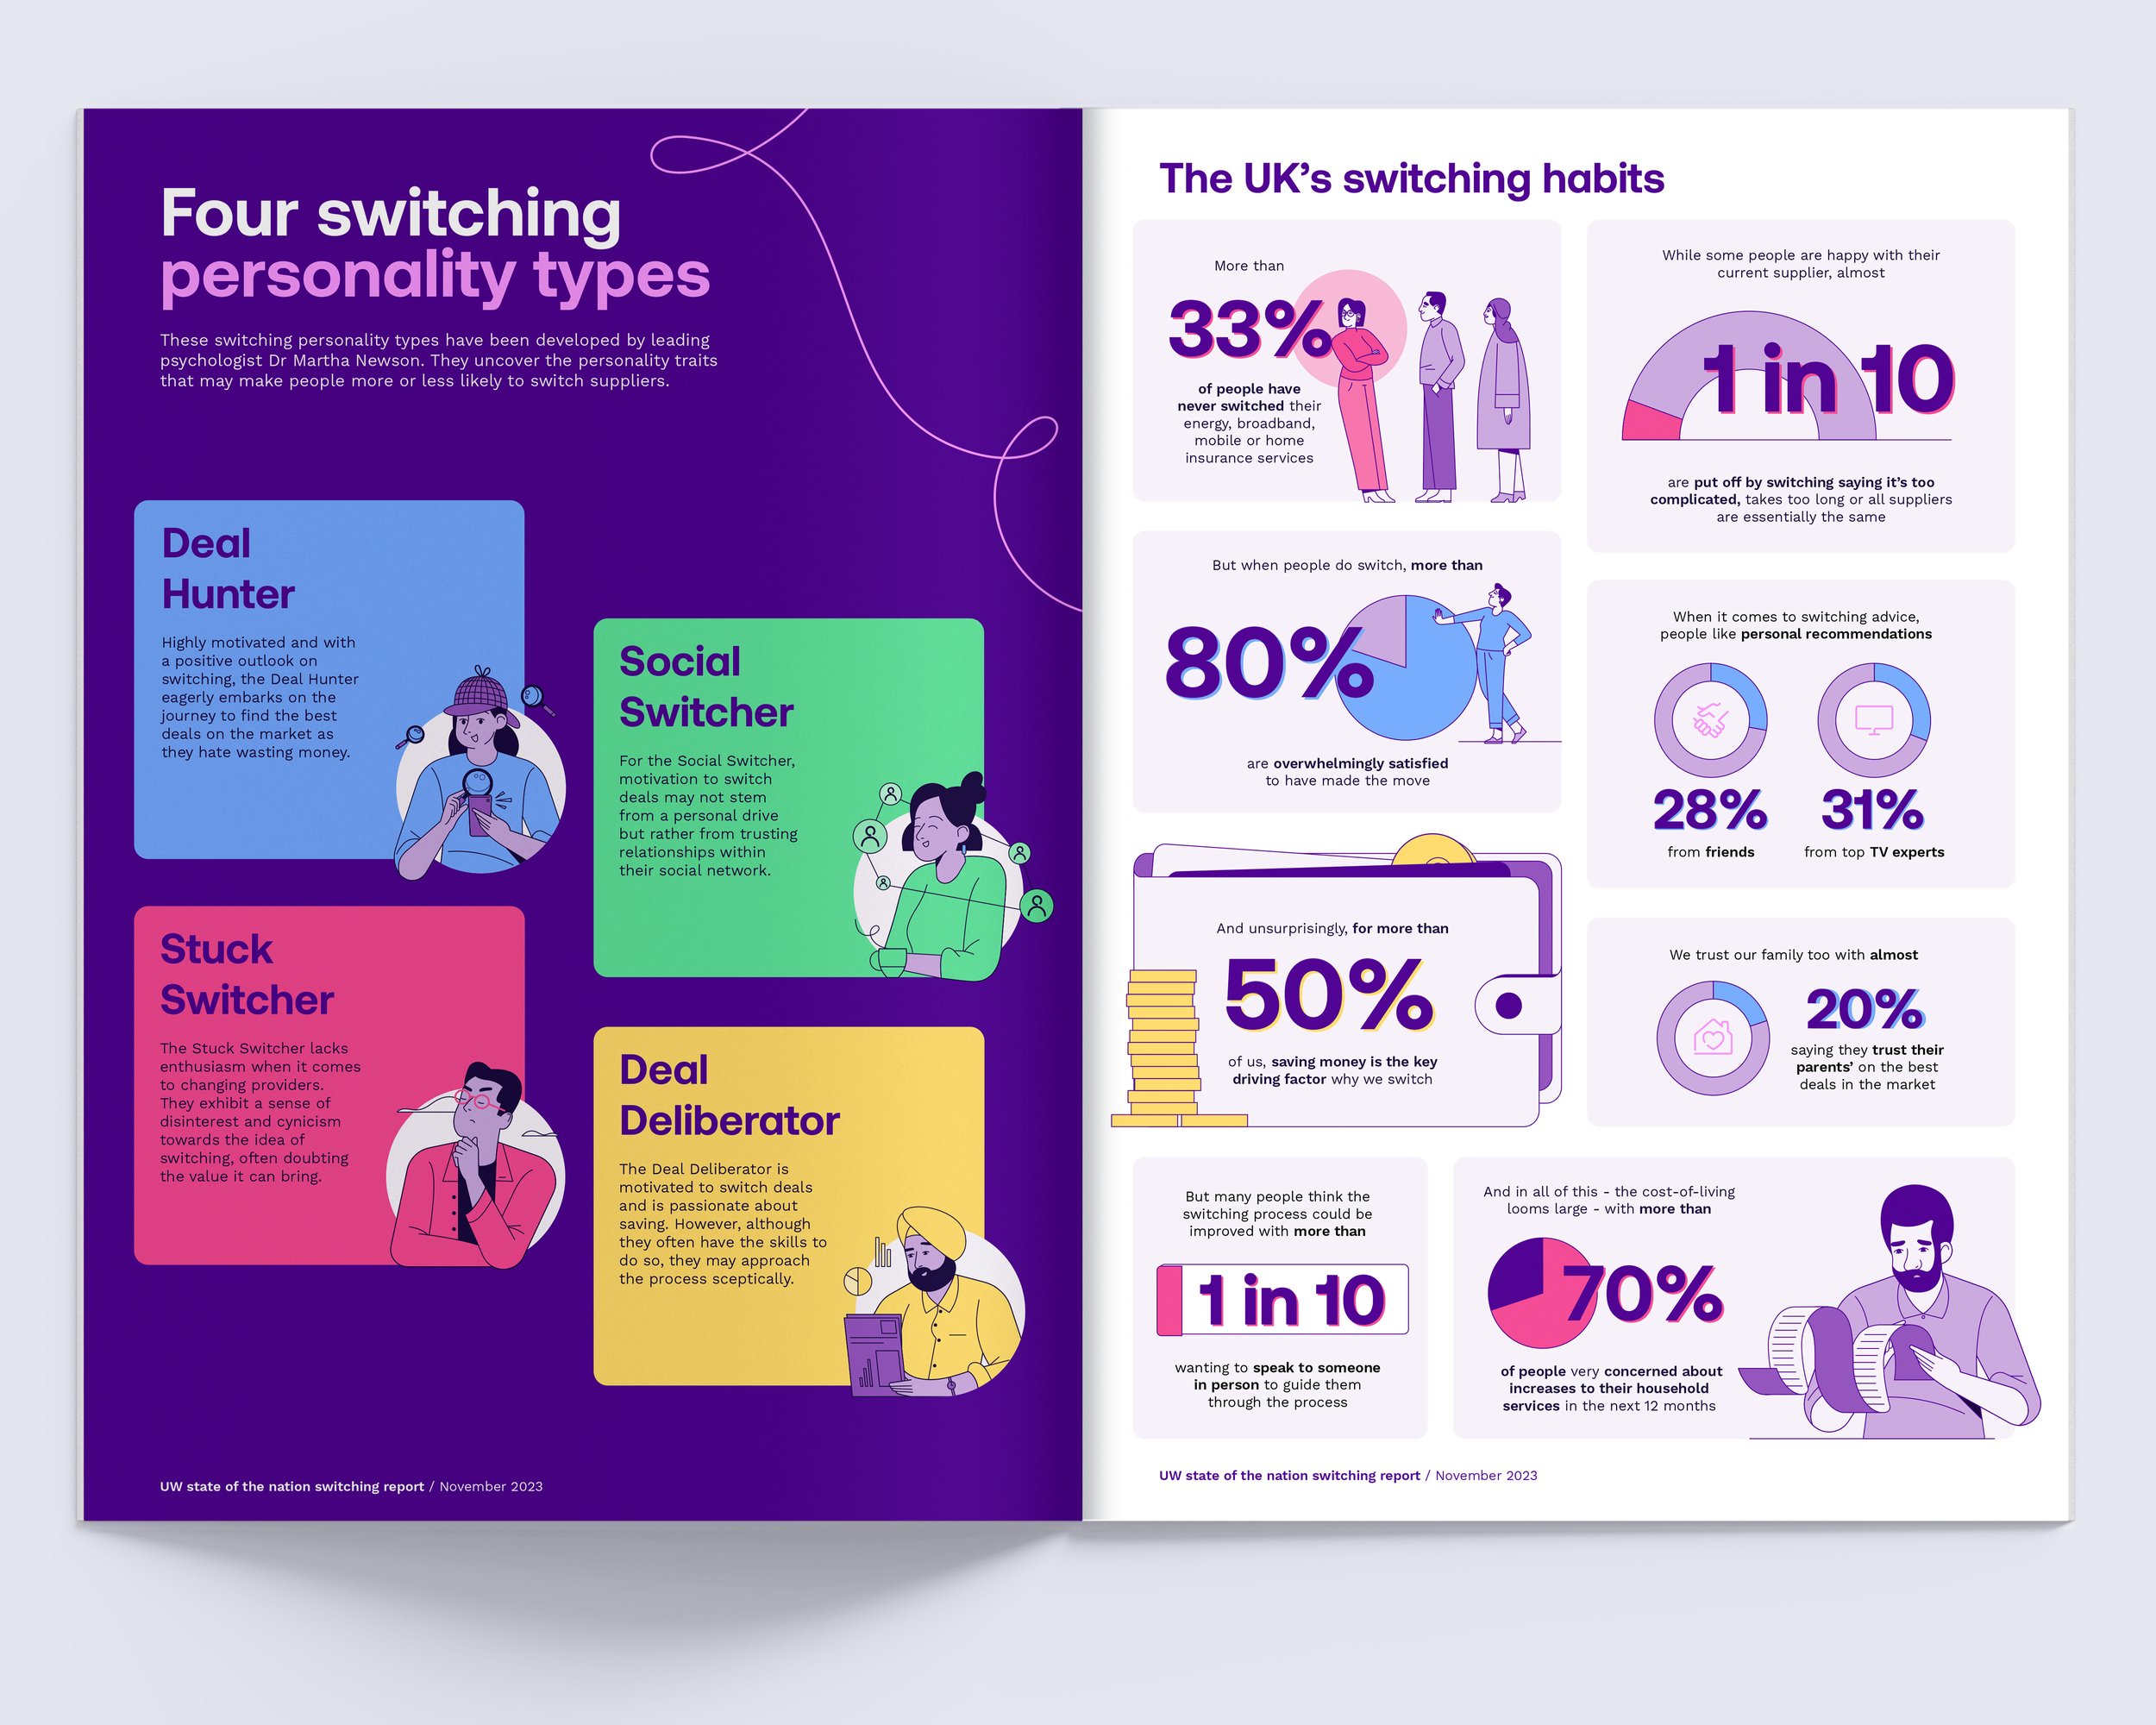
Utility Warehouse
‘Switching personas’ report
The client: Utility Warehouse is a multiservice provider.
The project: A nationwide survey to lift the lid on switching behaviours, shining new light on: how and why people switch their home services, and how many people are leaving better deals on the table.
Industry: Utilities
Printed/Digital Report
Social Cards
Capgemini ‘Simultaneous transformation’
report
Commissioned on behalf of: BrandpieThe client: Capgemini is a multinational information technology services and consulting company.
The project: The number of digital transformation initiatives underway has steadily increased in recent years. The report explain how CIOs need to transform complex IT landscapes and organisations into a new, thriving digital IT reality.
Industry: Information technology (IT)
Full report can be downloaded from the Capgemini website.Commissioned on behalf of: Clarivate AnalyticsDrugs to watch report 2018
The project: Twelve new drugs are predicted to achieve annual sales of >$1 billion by 2022. The 40 pages report cover a wide range of therapeutic areas, including type 2 diabetes, endometriosis, epilepsy, hemophilia, HIV, migraine and opioid addiction. Data for this report were compiled from Clarivate Analytics' Cortellis database, the premier source of life sciences competitive analytics.
Industry: Pharmaceutical
Full report can be downloaded from the Clarivate website.Launch outcome: 1.1 B impressions on media
2,898 total downloads
In 2018, number of total downloads quadrupled compared to the previous year. Downloads were 8.3x 2017 numbers, representing 728% growth.
The Guardian
x NCTL
The project: Fully responsive infographic ‘"Get into teaching, 5 key facts”. Published on The Guardian website, commissioned by the National College for Teaching and Leadership (NCTL).
Industry: Education
*Pitch work*
Commissioned on behalf of :
Data Design Studios
MCS
The project: With streaming becoming increasingly popular, the client and its music industry partners wanted to investigate how to increase engagement with paid streaming services.
Industry: Entertainment, Music
Commissioned on behalf of :
Data Design Studios
ICMM
The client: ICMM (International Council of Mining and Metals) is a leadership organisation, on the premise of improving sustainable development in the mining and metals industry.
Industry: Mining and metals


